
Manager reports let you schedule automated, team-level reports to be sent directly to managers in your organization. Each report gives managers a clear picture of how their team is engaging with Moxso — including resilience scores, training activity, and phishing simulation results — so they can act on the data directly.
How it works
Manager reports pull data from your Active Directory integration (e.g., Entra ID or Google Workspace), using the manager hierarchy already in your directory. Each report is sent by email to the manager you specify, covering the team members who report to them. You can optionally roll up reporting to include everyone further down the hierarchy.
Set up a manager report
Step 1: Turn on manager data
- Go to Settings > Integrations.
- Click the settings icon for your integration.
- Turn on Enable synchronization, if it isn't on already. Managers only shows when synchronization is on.
- Turn on Managers.
- Click Save settings.
- Go back to Settings > Integrations and click Refresh data next to your integration.
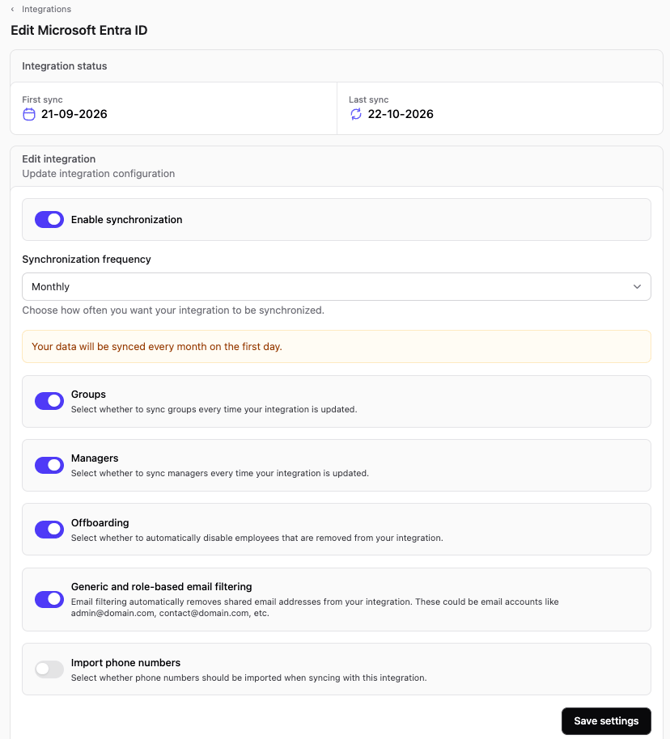
Manager reports need manager data in your directory. To check that it's working, go to Employees in the navigation bar on the left and open an employee's profile. The manager's name shows at the top right, next to the employee's status.

Step 2: Create the report
- Go to Settings > Reporting.
- Click Add report.
- Select Manager report.

Step 3: Set up the report
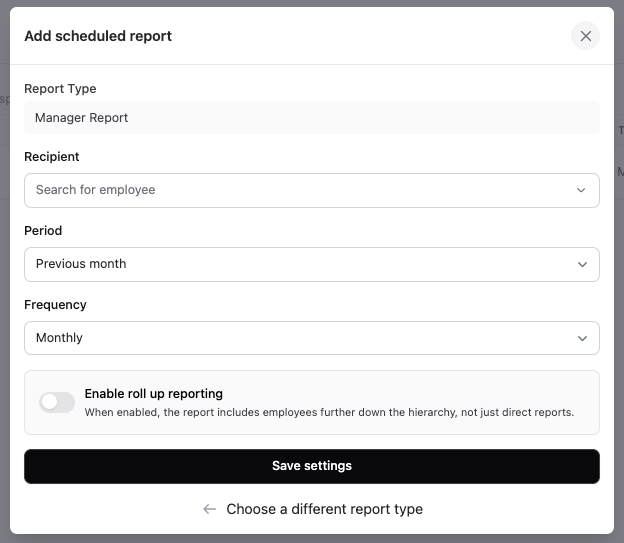
- Under Recipient, select the manager who receives the report. The report covers this manager's team.
- Under Period, choose the time the report covers.
- Under Frequency, choose how often the report is sent.
Notes on period and frequency:
- Quarters follow calendar quarters: January to March, April to June, July to September, and October to December.
- Periods always refer to the most recently completed period. For example, a report set to Last quarter with Monthly frequency that is sent in May shows January to March data, since Q2 isn't complete yet.
- Reports are sent at the start of each frequency period: weekly reports go out on Monday, and monthly reports on the 1st of the month.
- The period looks at data within the current calendar year. A Previous year period with Monthly frequency shows only the completed months so far. For example, the March report shows January and February data.
- For the most relevant data, match the frequency to the period. If you want last month's data, set the period to Previous month and the frequency to Monthly.
Step 4: Save the report
- (Optional) Turn on Enable roll up reporting to include everyone further down the hierarchy, not only the manager's direct reports.
- Click Save settings. The report is now active and is sent on schedule.
To preview a report before it's sent, go to Settings > Reporting, click the menu (three dots) next to the report, and click Download.
Reading the report
The report is a PDF. It has a team summary, a list of the team’s missed deadlines, and then a page for each employee. Inactive and anonymized employees aren’t included.
Most numbers are shown next to the value from the previous period, so managers can see whether things are getting better or worse.
Summary
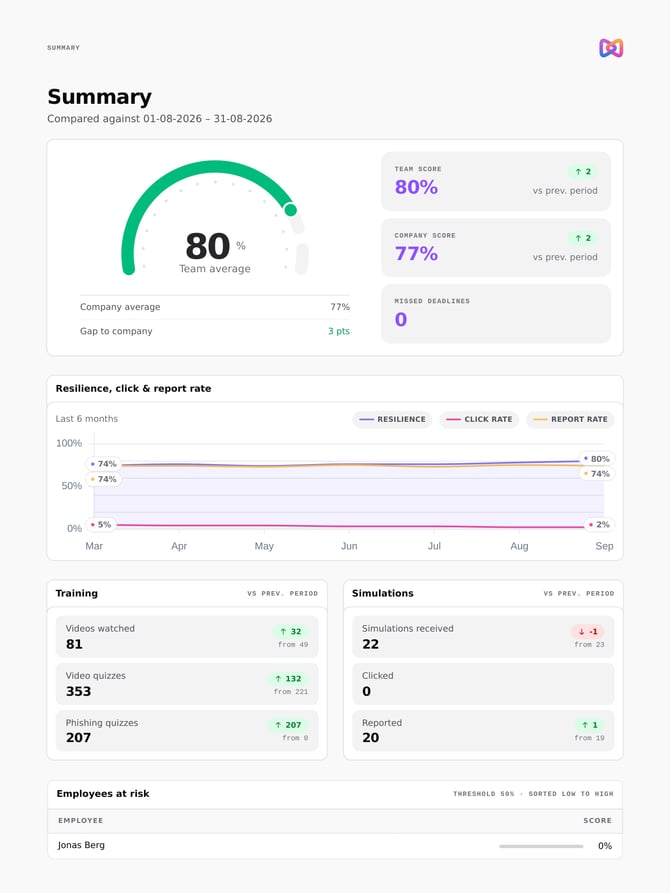
- The team’s average resilience score compared with the company average
- Training and phishing simulation activity
- Missed deadlines
- Employees with a low resilience score, flagged as at risk
Missed team deadlines
A list of the team’s overdue assignments, with the number of employees affected and the oldest deadline.
Employee pages
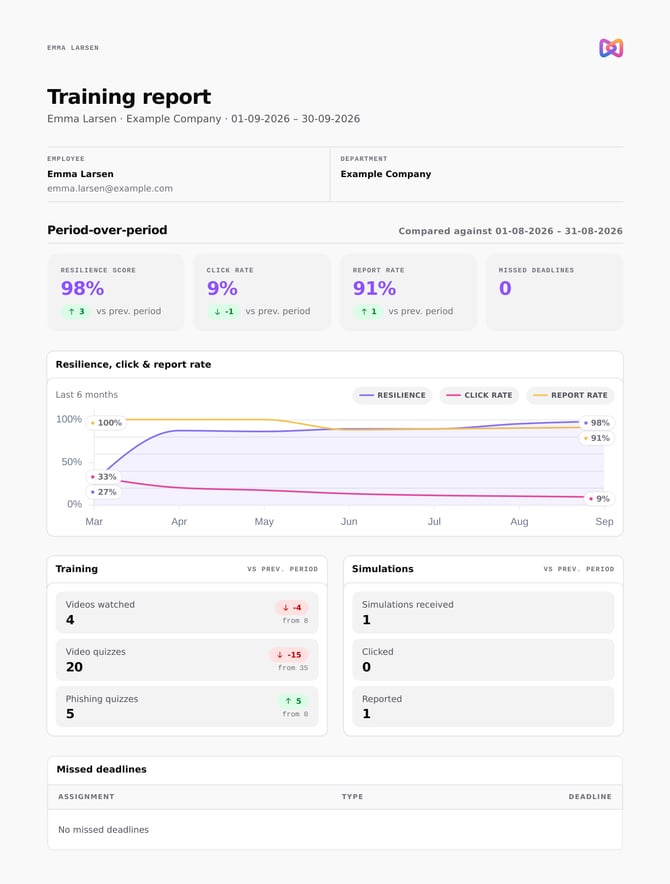
Each employee has a Training report page with the same numbers as the summary, plus a list of their own missed deadlines.
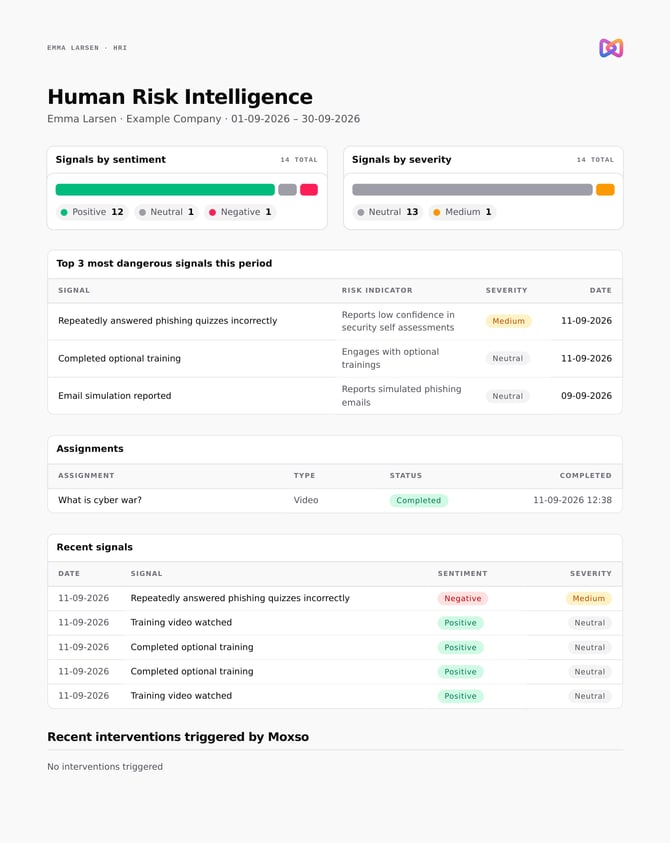
If Human Risk Intelligence (HRI) is turned on, a second page shows the employee’s HRI signals by sentiment and severity, their most serious signals in the period, their HRI assignments, and any interventions Moxso started.
What time period each number covers
The numbers in the report don’t all cover the same period. Most questions about the report come from this, so it’s worth explaining it to managers before their first report arrives.
| Number | Time period |
|---|---|
| Click rate, Report rate | The last 12 months |
| Videos watched, Video quizzes, Phishing quizzes | The report period |
| Simulations received, Clicked, Reported | The report period |
| Resilience score | The employee’s score at the end of the report period |
| Missed deadlines | All training the employee has missed and not completed yet, no matter how old |
For example, the employee in the screenshot has a click rate of 9% but Clicked: 0. They didn’t click any simulations in September, but they did click one at some point in the last 12 months.
Click rate and report rate use 12 months so that one simulation doesn’t make the number jump up and down. A rate based on a single month can go from 0% to 50% because of one click.
Common questions
Why does the report show a click rate but 0 clicks?
Click rate covers the last 12 months. Clicked only counts the report period. See the “What time period each number covers” section.
Why can Reported be higher than Simulations received?
Reported counts every report the employee made during the period. Some of those reports can be for simulations they received in an earlier period.
Why does an employee have missed deadlines from before the report period?
Missed deadlines include all training the employee has missed and hasn’t completed yet, so managers can see who has fallen behind. When the employee completes the training, it no longer counts in new reports.
Tips for managers
When a manager receives their report, the most useful place to start is the summary page. It shows at a glance how the team compares to the rest of the company and highlights any employees with missed deadlines or a low resilience score.
From there, the manager can scroll to that employee's individual page to understand why their score is low. For example: are they completing phishing simulations but not engaging with training videos? That detail makes the data actionable.
Before the first report goes out, it's worth giving managers a heads-up — let them know when to expect it, how to read it, and what the company's goals are. That context helps them turn the data into concrete next steps.