
What Insights shows
Insights is organized across three areas.
-
Human risk covers individual and aggregate risk levels, high-risk users, risk exposure, and risk velocity.
-
Organization covers industry benchmarks and active threats in your industry and country.
-
Program covers action effectiveness, compliance audit tracking, and progress against your security goals.
Three metrics feed these areas.
-
Risk exposure shows where risk is concentrating, by individual and by team.
-
Risk velocity measures how quickly risk is changing over time.
-
Action effectiveness tracks whether assignments and interventions are reducing risk scores over time.
The Resilience Score
The Resilience Score is a single numerical measure of risk across your organization, calculated at the individual, team, and organization level. It updates after every action.
Because every risk category in the Moxso Risk Framework maps to ISO 27001, NIS2, and SOC 2, the score can be reported against the compliance frameworks your organization is accountable to.
The Overview screen
You'll find Insights under Human risk intelligence > Overview in the left navigation.
Four widgets relate directly to the three metrics and the Resilience Score.
The Current resilience score widget shows the organization's overall score and the percentage change over the selected time period.
The Signal risk matrix shows how collected signals are distributed across impact and likelihood.
The Trending risk indicators widget lists the most active risk indicators from the Moxso Risk Framework, ranked by signal volume.
The Risk level widget shows the overall risk score on a scale of 1 to 10, with a breakdown by country risk and industry risk. This data is powered by Moxso OSINT.
The remaining widgets show system activity:
- Signals: negative and positive signal counts with trend lines
- Assignments: total assignments and completed, with trend lines
- Interventions: total interventions and completed
- Signal ingestion: total signal volume over the selected period, with peak day and average day counts
- Signals over time: signal volume as a bar chart by month
- Group breakdown: signals, assignments, and interventions per group, including average resilience score per group
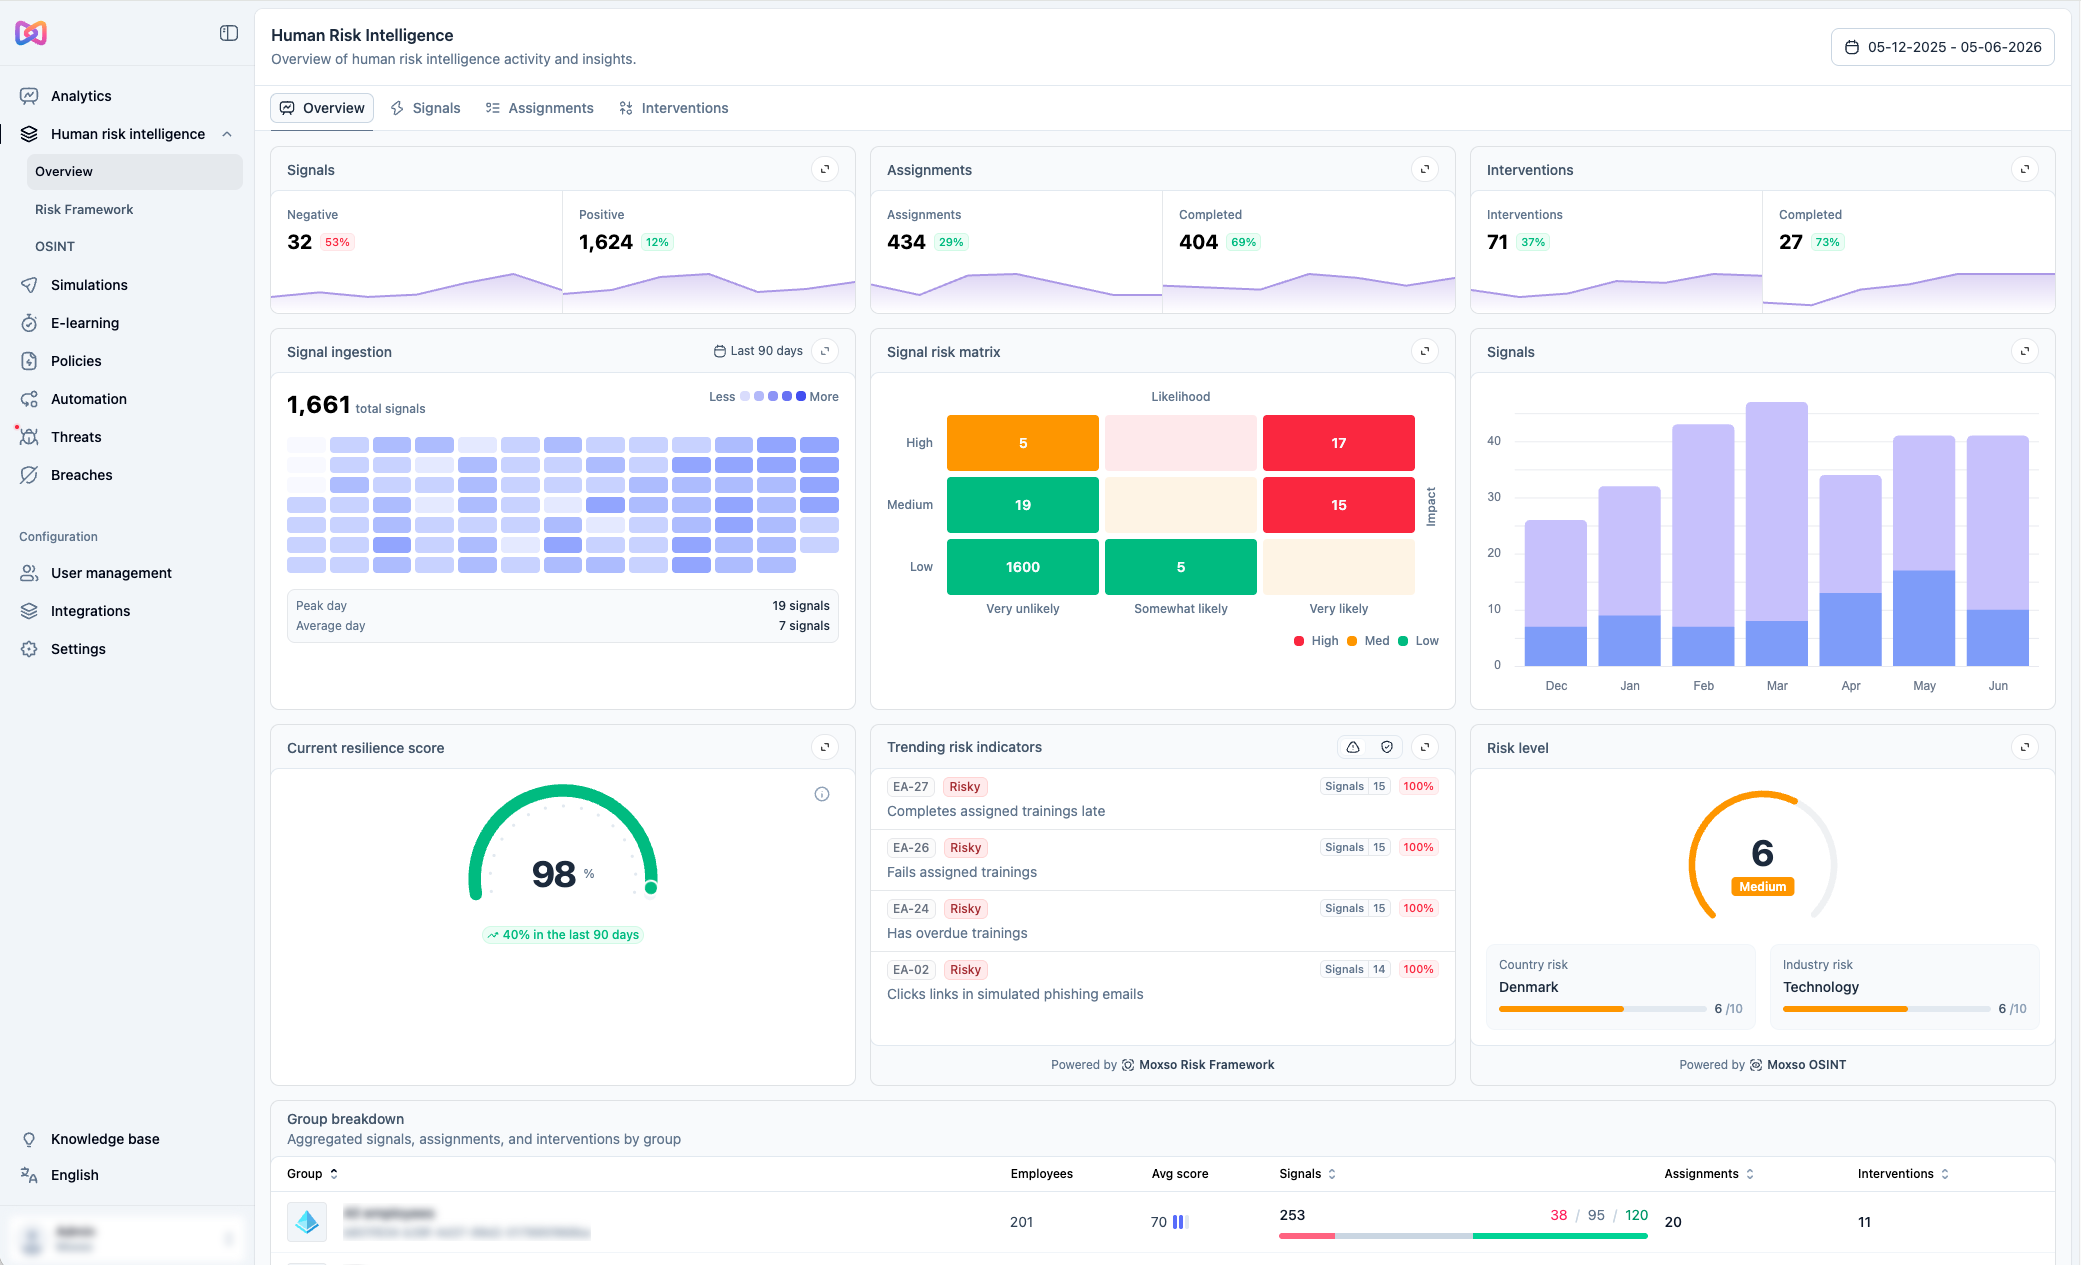
Learn more about how to make sense of the HRI Overview screen in this article: How do I read the Human risk intelligence Overview screen?
Audit evidence
The Insights section gives compliance officers and auditors a view of how risk has developed over time. Across the Signals, Assignments, and Interventions screens, you can see what events were recorded, what actions were taken in response, and how risk scores have changed. This data is structured around the Moxso Risk Framework categories, which map to ISO 27001, NIS2, and SOC 2.