Where do I go?
You will need to access the Analytics tab on the left of your Admin. This section compiles data and analysis from the various features of Moxso, including phishing Simulations, Training and Reporting.
What should I think of when looking at the data?
- Do the numbers align with your expectations? With your objectives?
- See our recommended goals in this guide.
- Are any employees still not onboarded?
- Who are the employees at risk?
- How is the click rate evolving?
- How is the reporting rate?
- Are your employees completing the training as expected?
Find below a detailed breakdown of the numbers in the dashboard.
What do these numbers mean?
In each section, do not forget you can change the date scope to the timeline that you wish to examine at the top right. Each of these will update the numbers to that particular context so you can easily focus on the numbers that you wish to drill down into.
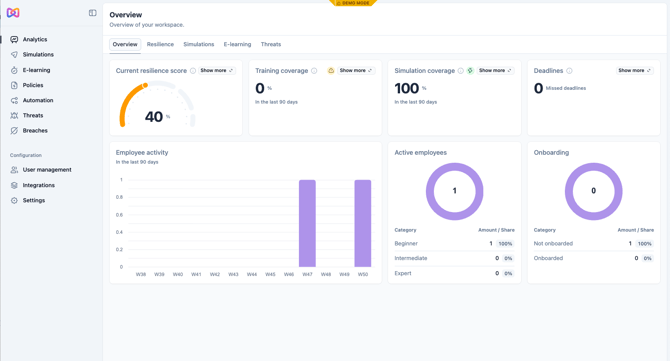
In the Overview section:
- Resilience Score
- This is an average of all employee scores. It is calculated in terms of all activities employees can fulfill. If you’d like to learn more about how this score is calculated, see our guide How is the Resilience Score calculated.
- Training and Simulation coverage
- Gives you an understanding of how many of your employees have completed these.
- Deadlines
- Highlights how many training sessions have not been completed in time. If you click into Show more, you can set up reminders individually or to the group who has missed.
- Employee activity
- Gives you an understanding of your company activity over time.
- Active employees
- Shows you the number of employees who have engaged with an activity. The beginner, intermediate and expert categories are calculated as follows using user points (seen in the top right of each employee’s hub):
- -500 to 401 is beginner
- 402 to 1401 is intermediate
- >1401 is expert
- Shows you the number of employees who have engaged with an activity. The beginner, intermediate and expert categories are calculated as follows using user points (seen in the top right of each employee’s hub):
- Onboarding
- Is defined by whether the employee has logged into their first course.
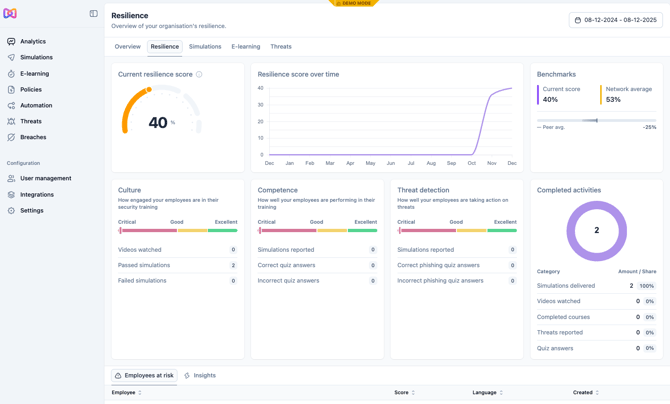
In the Resilience tab:
- You can see the score as it is now and over time. It is common to see a gradual increase as the employees are getting training.
- Benchmarks
- Allows you to compare your score to the average in our network of customers using Moxso.
- The peer average is an average of all our customers' resilience scores.
- Culture, Competence, and Threat detection
- You can then see how your company is doing in our different categories bringing together the Moxso activities.
- Completed activities
- See what activities have been completed in order to determine where your employees are most active and which activities may need more promotion.
- Employees at risk
- Lists the employees that need most attention.
- This helps you make more targeted actions to lower the risks and increase resilience score.
- You can go into each employee to get a drilldown of their stats and activities.
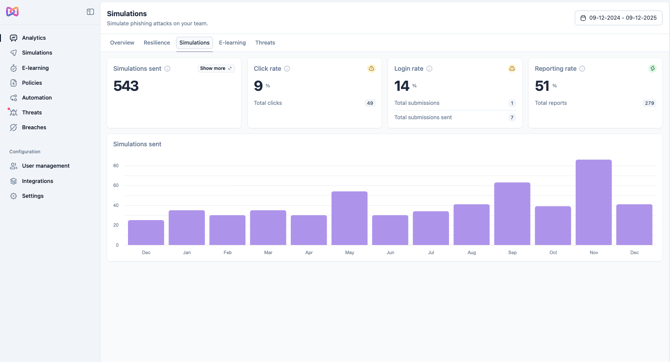
In the Simulations tab:
- Simulations sent
- See how many campaigns have been sent and if you click on Show more, access the Simulations configuration page.
- Click rate
- See how your campaigns have been interacted with by your employees. This specifically looks at whether or not they have clicked the links inside the emails.
- Login rate
- These numbers give you some insight into cases where employees have entered their details in a Simulation including credential harvesting (available on Adapt and Defend plans).
- Total submissions sent is how many emails with the credential harvesting employees have received.
- Total submissions is how many inputs have been made into the credential harvesting by employees.
- Reporting rate
- This shows you the amount of reporting from your employees (available on Understand, Adapt and Defend plans).
- Simulations sent
- You can find here your simulation history over time.
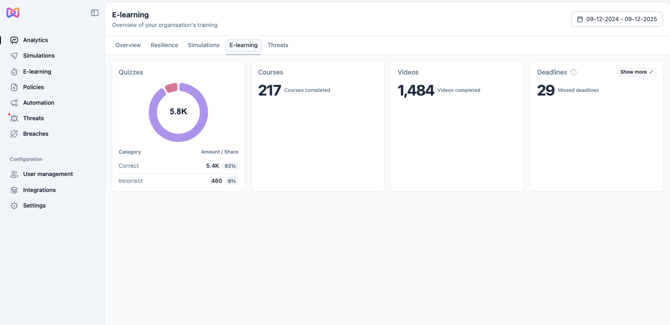
In the E-Learning tab:
- Quizzes
- You can find the breakdown of quizzes answered and the results.
- Courses
- See how many courses have been completed
- Videos
- Learn how many videos have been watched and tied quizzes completed.
- Deadlines
- See how many missed deadlines there have been. Keep in mind that once the employee has fulfilled the task, they will no longer be counted as having missed a deadline and the number here will update.
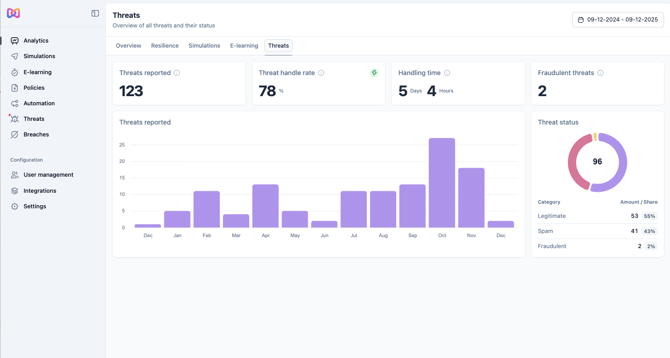
In the Threats tab (available on Adapt and Defend plans):
- You can find here data points on how many threats were reported, handled and in how long this occurred. A threat counts as handled once you have marked it to be either fraudulent, spam, or legitimate.
- Threats reported
- See the reports over time.
- Fraudulent threats
- This tells you how many were actually sources of risk.
- Threats status
- Find the breakdown of threats by category.
- Fraudulent means it was deemed actually phishing.
- Legitimate means it was not a phishing email.
- Spam means it was deemed not phishing but still junk email.
- Find the breakdown of threats by category.